Distributed Tracing
This task shows you how Istio-enabled applications can be configured to collect trace spans using Zipkin or Jaeger. After completing this task, you should understand all of the assumptions about your application and how to have it participate in tracing, regardless of what language/framework/platform you use to build your application.
The Bookinfo sample is used as the example application for this task.
Before you begin
Setup Istio by following the instructions in the Installation guide.
If you didn’t start the Zipkin or Jaeger addon during installation, you can run the following command to start it now.
For Zipkin:
kubectl apply -f install/kubernetes/addons/zipkin.yamlFor Jaeger:
kubectl apply -n istio-system -f https://raw.githubusercontent.com/jaegertracing/jaeger-kubernetes/master/all-in-one/jaeger-all-in-one-template.ymlDeploy the Bookinfo sample application.
Accessing the dashboard
Zipkin
Setup access to the Zipkin dashboard URL using port-forwarding:
kubectl port-forward -n istio-system $(kubectl get pod -n istio-system -l app=zipkin -o jsonpath='{.items[0].metadata.name}') 9411:9411 &
Then open your browser at http://localhost:9411
Jaeger
Setup access to the Jaeger dashboard URL using port-forwarding:
kubectl port-forward -n istio-system $(kubectl get pod -n istio-system -l app=jaeger -o jsonpath='{.items[0].metadata.name}') 16686:16686 &
Then open your browser at http://localhost:16686
Generating traces using the Bookinfo sample
With the Bookinfo application up and running, generate trace information by accessing http://$GATEWAY_URL/productpage one or more times.
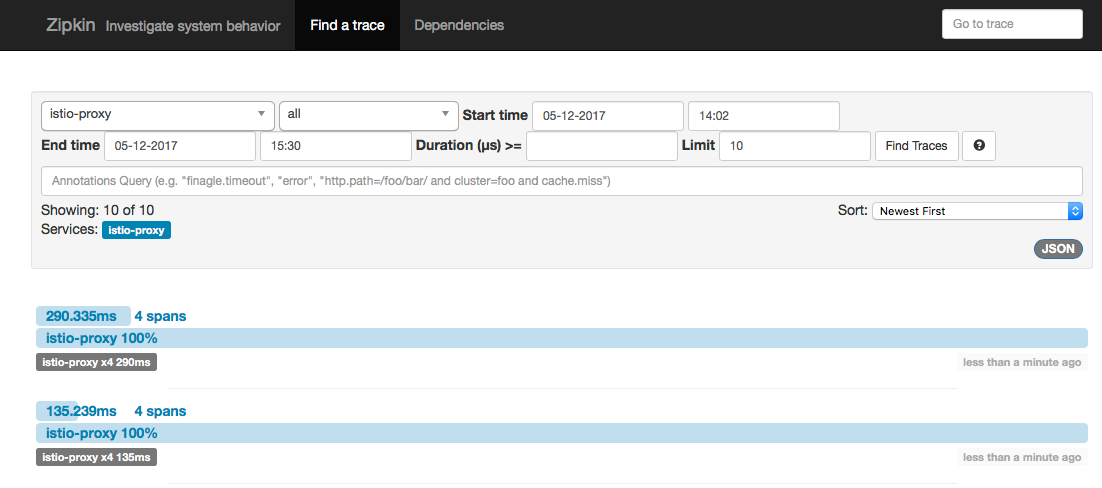
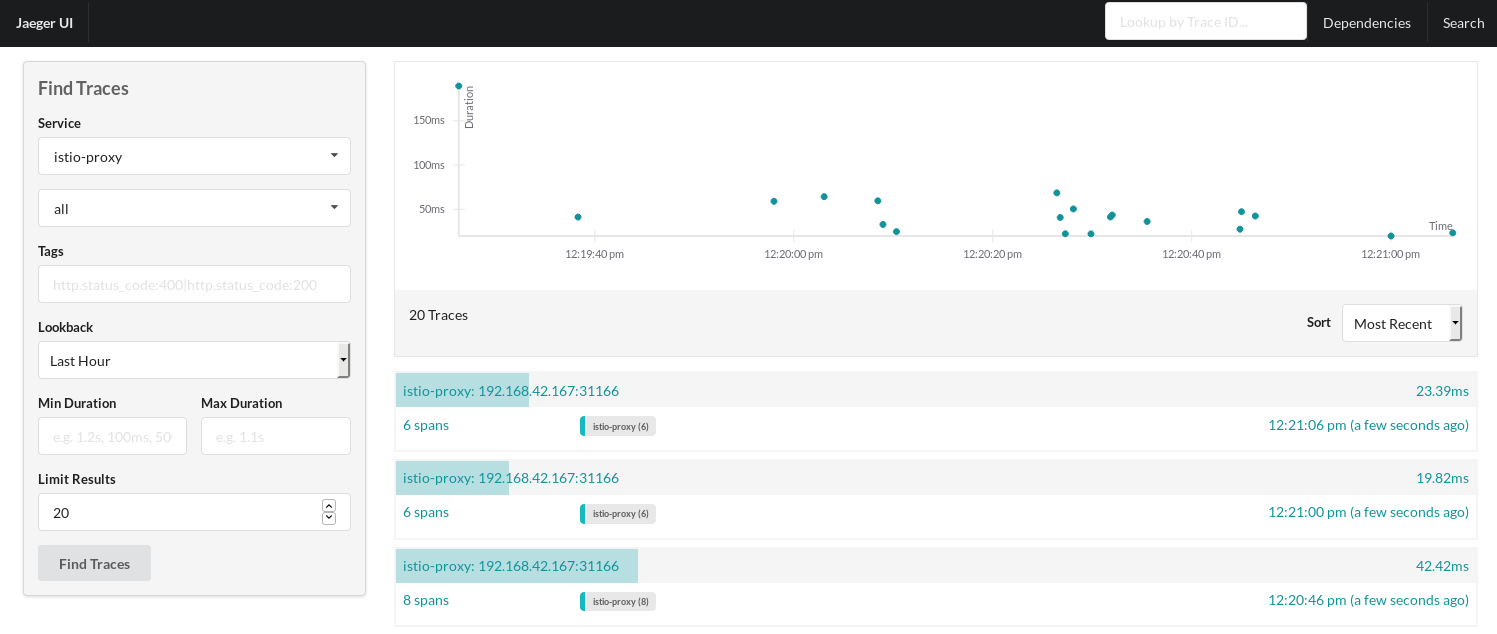
If you now look at the dashboard, you should see something similar to the following:
If you click on the top (most recent) trace, you should see the details corresponding to your latest refresh of the /productpage. The page should look something like this:
As you can see, the trace is comprised of spans, where each span corresponds to a Bookinfo service invoked during the execution of a /productpage request. Although every service has the same label, istio-proxy, because the tracing is being done by the Istio sidecar (Envoy proxy) which wraps the call to the actual service, the label of the destination (to the right) identifies the service for which the time is represented by each line.
The first line represents the external call to the productpage service. The label 192.168.64.3:32000 is the host value used for the external request (i.e., $GATEWAY_URL). As you can see in the trace, the request took a total of roughly 290ms to complete. During its execution, the productpage called the details service, which took about 24ms, and then called the reviews service. The reviews service took about 243ms to execute, including a 15ms call to ratings.
Understanding what happened
Although Istio proxies are able to automatically send spans, they need some hints to tie together the entire trace. Applications need to propagate the appropriate HTTP headers so that when the proxies send span information to Zipkin or Jaeger, the spans can be correlated correctly into a single trace.
To do this, an application needs to collect and propagate the following headers from the incoming request to any outgoing requests:
x-request-idx-b3-traceidx-b3-spanidx-b3-parentspanidx-b3-sampledx-b3-flagsx-ot-span-context
If you look in the sample services, you can see that the productpage application (Python) extracts the required headers from an HTTP request:
def getForwardHeaders(request):
    headers = {}

    user_cookie = request.cookies.get("user")
    if user_cookie:
        headers['Cookie'] = 'user=' + user_cookie

    incoming_headers = [ 'x-request-id',
                         'x-b3-traceid',
                         'x-b3-spanid',
                         'x-b3-parentspanid',
                         'x-b3-sampled',
                         'x-b3-flags',
                         'x-ot-span-context'
    ]

    for ihdr in incoming_headers:
        val = request.headers.get(ihdr)
        if val is not None:
            headers[ihdr] = val
            #print "incoming: "+ihdr+":"+val

    return headers
The reviews application (Java) does something similar:
@GET
@Path("/reviews")
public Response bookReviews(@CookieParam("user") Cookie user,
                            @HeaderParam("x-request-id") String xreq,
                            @HeaderParam("x-b3-traceid") String xtraceid,
                            @HeaderParam("x-b3-spanid") String xspanid,
                            @HeaderParam("x-b3-parentspanid") String xparentspanid,
                            @HeaderParam("x-b3-sampled") String xsampled,
                            @HeaderParam("x-b3-flags") String xflags,
                            @HeaderParam("x-ot-span-context") String xotspan) {
  String r1 = "";
  String r2 = "";

  if(ratings_enabled){
    JsonObject ratings = getRatings(user, xreq, xtraceid, xspanid, xparentspanid, xsampled, xflags, xotspan);
When you make downstream calls in your applications, make sure to include these headers.
Cleanup
Remove the addon tracing configuration:
If you are running with Zipkin, run the following command to cleanup:
kubectl delete -f install/kubernetes/addons/zipkin.yamlIf you are running with Jaeger, run the following command to cleanup:
kubectl delete -f https://raw.githubusercontent.com/jaegertracing/jaeger-kubernetes/master/all-in-one/jaeger-all-in-one-template.ymlIf you are not planning to explore any follow-on tasks, refer to the Bookinfo cleanup instructions to shutdown the application.
What’s next
- Learn more about Metrics and Logs


